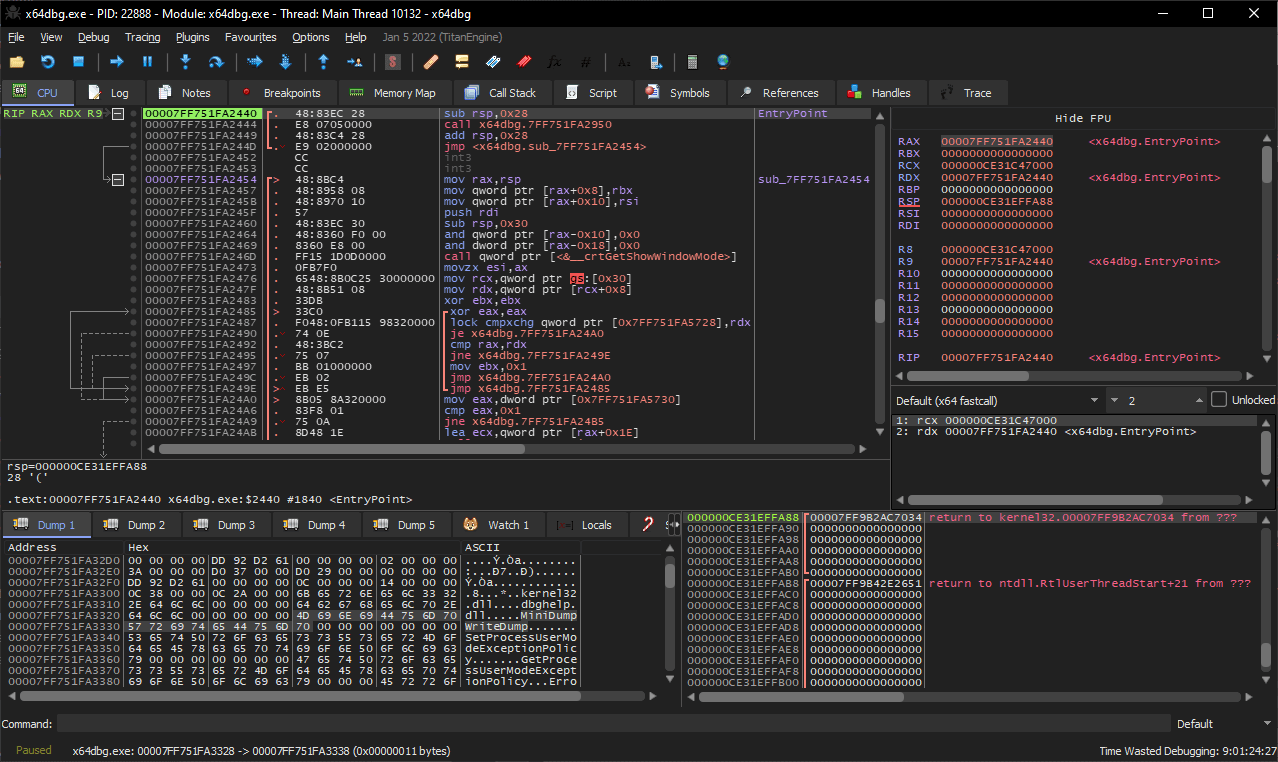
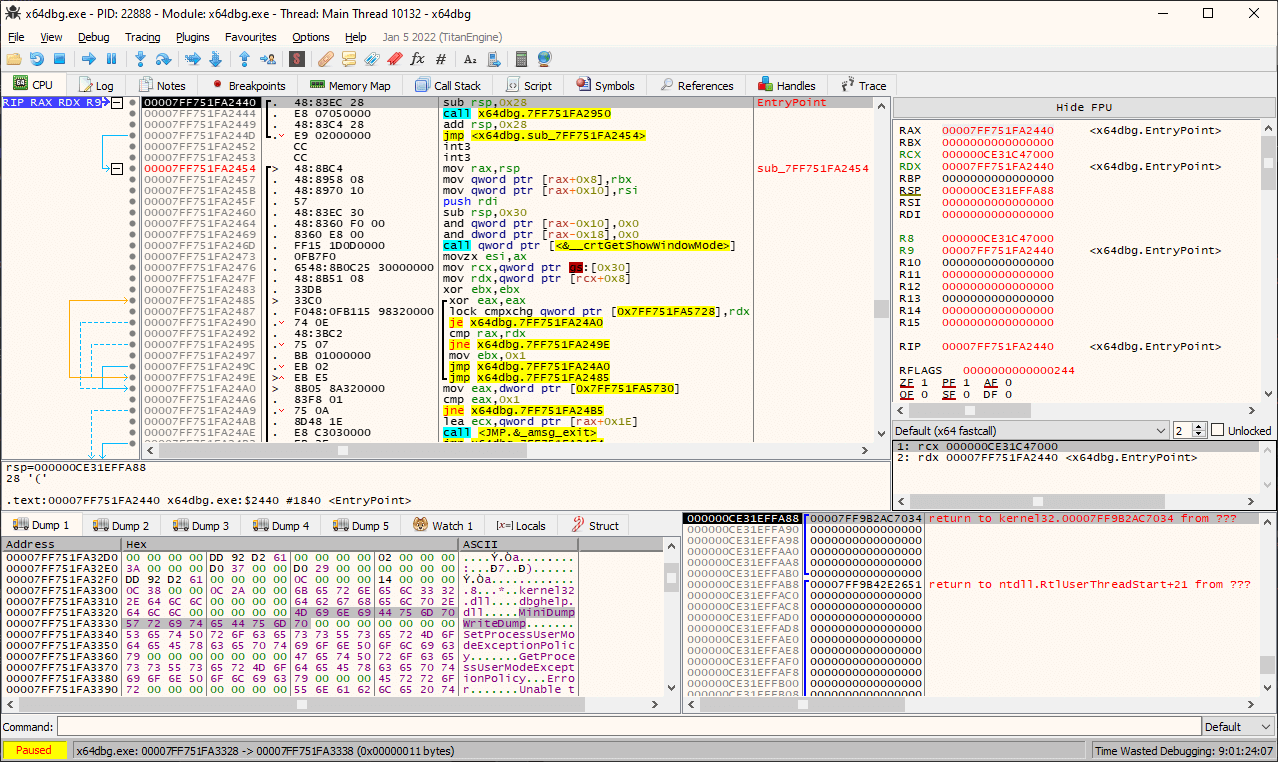
x64dbg is an open-source debugger for Windows that is a popular analysis tool . A debugger is used to step through code as it executes, so you can see exactly what it’s doing. Debuggers are essential for troubleshooting bugs, but they’re also used to reverse engineer.
Assembly code is a low-level programming language designed for a specific computer architecture such as 64bit architecture, hence the name x64dbg. There is also a version for 32bit architecture known as x32dbg.
Features
- Open-source
- Intuitive and familiar, yet new user interface
- C-like expression parser
- Full-featured debugging of DLL and EXE files (TitanEngine)
- IDA-like sidebar with jump arrows
- IDA-like instruction token highlighter (highlight registers etc.)
- Memory map
- Symbol view
- Thread view
- Content-sensitive register view
- Fully customizable color scheme
- Dynamically recognize modules and strings
- Import reconstructor integrated (Scylla)
- Fast disassembler (BeaEngine)
- User database (JSON) for comments, labels, bookmarks etc.
- Plugin support with growing API
- Extendable, debuggable scripting language for automation
- Multi-datatype memory dump
- Basic debug symbol (PDB) support
- Dynamic stack view
- Built-in assembler (XEDParse)
- Operating Systems - Windows
- Intended Audience - Science/Research, Developers, Security Professionals, Security
- User Interface - Qt
- Programming Language - C++


HideLinkAndCode_3.3.5.thumb.jpg.c7b06e769c2c0952090322212311195e.jpg)


